We ran out of superlatives to describe corporate America’s stunning performance during first-quarter earnings season. Despite lofty expectations, results exceeded expectations by one of the biggest margins ever. So what will companies do for an encore? We expect more good news this quarter as more of the economy has opened up, while also acknowledging the second quarter will almost certainly end up being the peak in earnings growth for this cycle. Here, we highlight what to watch.
Numbers Should Be Great Again
After a remarkable performance during first-quarter earnings season, delivering an encore that will please investors will be tough. Recall that S&P 500 Index earnings grew 52% year over year during the first quarter [Figure 1], which was nearly 30 percentage points above expectations at the end of the quarter. Before companies started to report first-quarter numbers, we had thought 30% earnings growth would be pretty good; 50% was practically inconceivable.
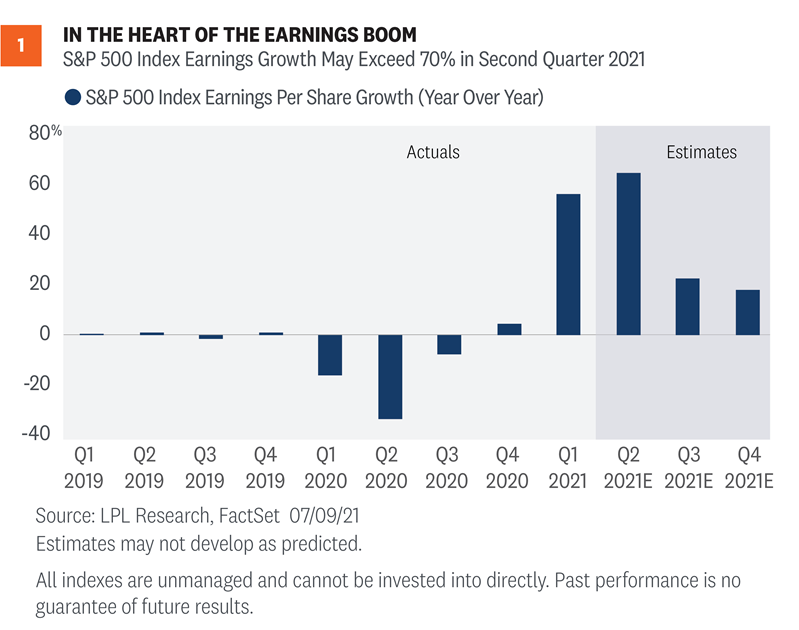
Despite the historic upside and significant growth in the first quarter, earnings are expected to grow even faster in the second quarter, though certainly helped by the comparison to the lockdowns of second quarter 2020. Given the potential that U.S. economic growth exceeds 10% in the second quarter (annualized, per Bloomberg consensus) and continued strong manufacturing activity as indicated by purchasing managers’ surveys, corporate America should have no trouble hitting the current consensus target earnings growth rate of 64%, which would mark the strongest growth since the fourth quarter of 2009 (source: FactSet).
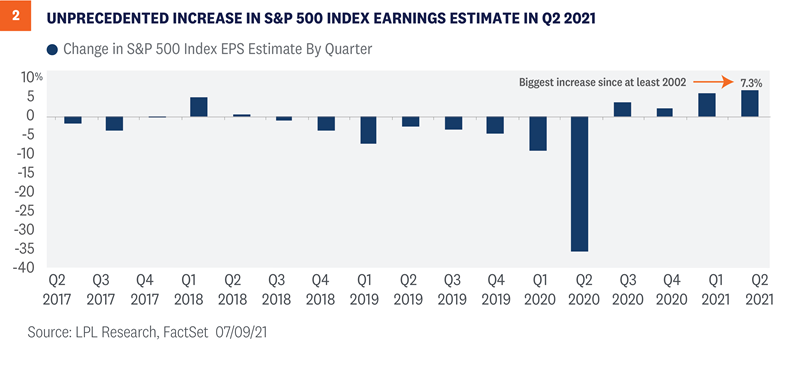
Also consider that the consensus S&P 500 earnings estimate for the second quarter increased more than 7% during the quarter—the most ever recorded since FactSet began tracking that statistic in 2002 [Figure 2]. Putting this into perspective, over the past 15 years this statistic has averaged a 5% decline. Pushing those estimates higher were 66 S&P 500 companies that raised guidance for the second quarter, the most since FactSet began tracking that metric in 2006. Earnings estimates for the energy, financials, and materials sectors saw the biggest positive revisions.
Turning to the top line, at no point during or since the 2008-09 financial crisis have S&P 500 companies in aggregate grown revenue 20% or more year over year. It looks like that mark may be exceeded this quarter, based on the 19.9% increase currently reflected by consensus.
Earnings are experiencing significant momentum that we don’t expect to stop anytime soon. We won’t predict 20 percentage points of upside again for the quarter, as we think the bar has been raised too high for that. But another quarter of double-digit percentage upside over estimates could be in the cards.
3 Things To Watch
Companies will start to report second-quarter results in earnest this week. Here are three things we will be watching as the numbers roll in and companies share thoughts about their second half outlooks:
- Is this as good as it gets? We like good news. Who doesn’t? But at some point, the good news is fully expected and factored into stock prices. That means markets may not respond as well to the next piece of good news. For the past few quarters, companies have delivered not just good, but great news. Now investors are rightly asking if the positive surprises may be coming to an end, as companies may no longer be holding anything back. If the outlooks from management teams are conservative again because of ongoing COVID-19 or other uncertainties, additional upside surprises could be in store for the second half and potentially drive the next leg of this rally.
- Outlook for hiring. Difficulty finding workers has hindered the job recovery. We had anticipated bigger job gains in recent months as the economy reopened. Some factors that we believe have restrained hiring include: 1) apprehension to return to work due to COVID-19; 2) child-care issues preventing some parents from returning to work; 3) companies have learned to do more with less during the pandemic, leveraging technology; 4) skill mismatches between the labor pool and the types of jobs available (though not a new problem); and 5) supplemental unemployment insurance reducing incentives for some to work. We are very interested to hear what companies have to say about future hiring and what that may mean for revenue and profit margins in coming quarters.
- “Stickiness” of inflation. Related to hiring but broader, the “stickiness” of inflation will go a long way toward determining how strong the next stage of the earnings recovery will be. Wages are a big component of corporate America’s cost structure (and a focus for the Federal Reserve), so we want to see if higher wages are hurting profit margins. But it will also be interesting to hear about supply chain bottlenecks and shortages of materials that have put upward pressure on costs and may impact profit margins.
Conclusion
We expect a strong second quarter earnings, but so do most market participants. With expectations high (again), it won’t be easy for companies to handily clear the bar like they did the past several quarters. We also recognize that stock valuations are elevated, so disappointments will likely be punished. Stocks need strong earnings to come through to justify those valuations, and we think we’ll get them. Our year-end S&P 500 fair value target range is 4,400—4450, based on a price-to-earnings multiple of 21.5 and our S&P 500 2022 earnings estimate of $205, which we think may be achievable even with a potential increase in the corporate tax rate next year.
We think we’ll get enough economic and earnings growth in the second half to push stocks higher from here as the rest of the economy reopens and more stimulus flows through, although those gains are likely to come with more volatility. In the near term we would expect pullbacks to be short-lived and shallow, and would therefore be looking for opportunities to add equities on potential dips. Risks include the Delta variant of COVID-19, a lasting surge in inflation, possible tax increases in 2022, and geopolitics.
For much more of our thoughts on the second half, check out our Midyear Outlook 2021 publication coming soon!
Click here to download a PDF of this report.
IMPORTANT DISCLOSURES
This material is for general information only and is not intended to provide specific advice or recommendations for any individual. There is no assurance that the view s or strategies discussed are suitable for all investors or w ill yield positive outcomes. Investing involves risks including possible loss of principal. Any economic forecasts set forth may not develop as predicted and are subject to change.
References to markets, asset classes, and sectors are generally regarding the corresponding market index. Indexes are unmanaged statistical composites and cannot be invested into directly. Index performance is not indicative of the performance of any investment and do not ref lect fees, expenses, or sales charges. All performance referenced is historical and is no guarantee of future results.
Any company names noted herein are for educational purposes only and not an indication of trading intent or a solicitation of their products or services. LPL Financial doesn’t provide research on individual equities.
All information is believed to be f rom reliable sources; how ever, LPL Financial makes no representation as to its completeness or accuracy.
US Treasuries may be considered “safe haven” investments but do carry some degree of risk including interest rate, credit, and market risk. Bonds are subject to market and interest rate risk if sold prior to maturity. Bond values w ill decline as interest rates rise and bonds are subject to availability and change in price.
The Standard & Poor’s 500 Index (S&P500) is a capitalization-weighted index of 500 stocks designed to measure performance of the broad domestic economy through changes in the aggregate market value of 500 stocks representing all major industries.
The PE ratio (price-to-earnings ratio) is a measure of the price paid for a share relative to the annual net income or prof it earned by the firm per share. It is a financial ratio used for valuation: a higher PE ratio means that investors are paying more for each unit of net income, so the stock is more expensive compared to one with lower PE ratio.
Earnings per share (EPS) is the portion of a company’s prof it allocated to each outstanding share of common stock. EPS serves as an indicator of a company’s profitability. Earnings per share is generally considered to be the single most important variable in determining a share’s price. It is also a major component used to calculate the price -to-earnings valuation ratio.
All index data f rom FactSet.
Please read the full Midyear Outlook 2021: Picking Up Speed publication, available Tuesday, July 13, 2021, for additional description and disclosure.
This research material has been prepared by LPL Financial LLC.
Securities and advisory services offered through LPL Financial (LPL), a registered investment advisor and broker-dealer (member FINRA/SIPC). Insurance products are offered through LPL or its licensed affiliates. To the extent you are receiving investment advice from a separately registered independent investment advisor that is not an LPL affiliate, please note LPL makes no representation with respect to such entity.
Not Insured by FDIC/NCUA or Any Other Government Agency | Not Bank/Credit Union Guaranteed | Not Bank/Credit Union Deposits or Obligations | May Lose Value
RES-761100-0521 | For Public Use | Tracking # 1-05165204 (Exp. 07/22)